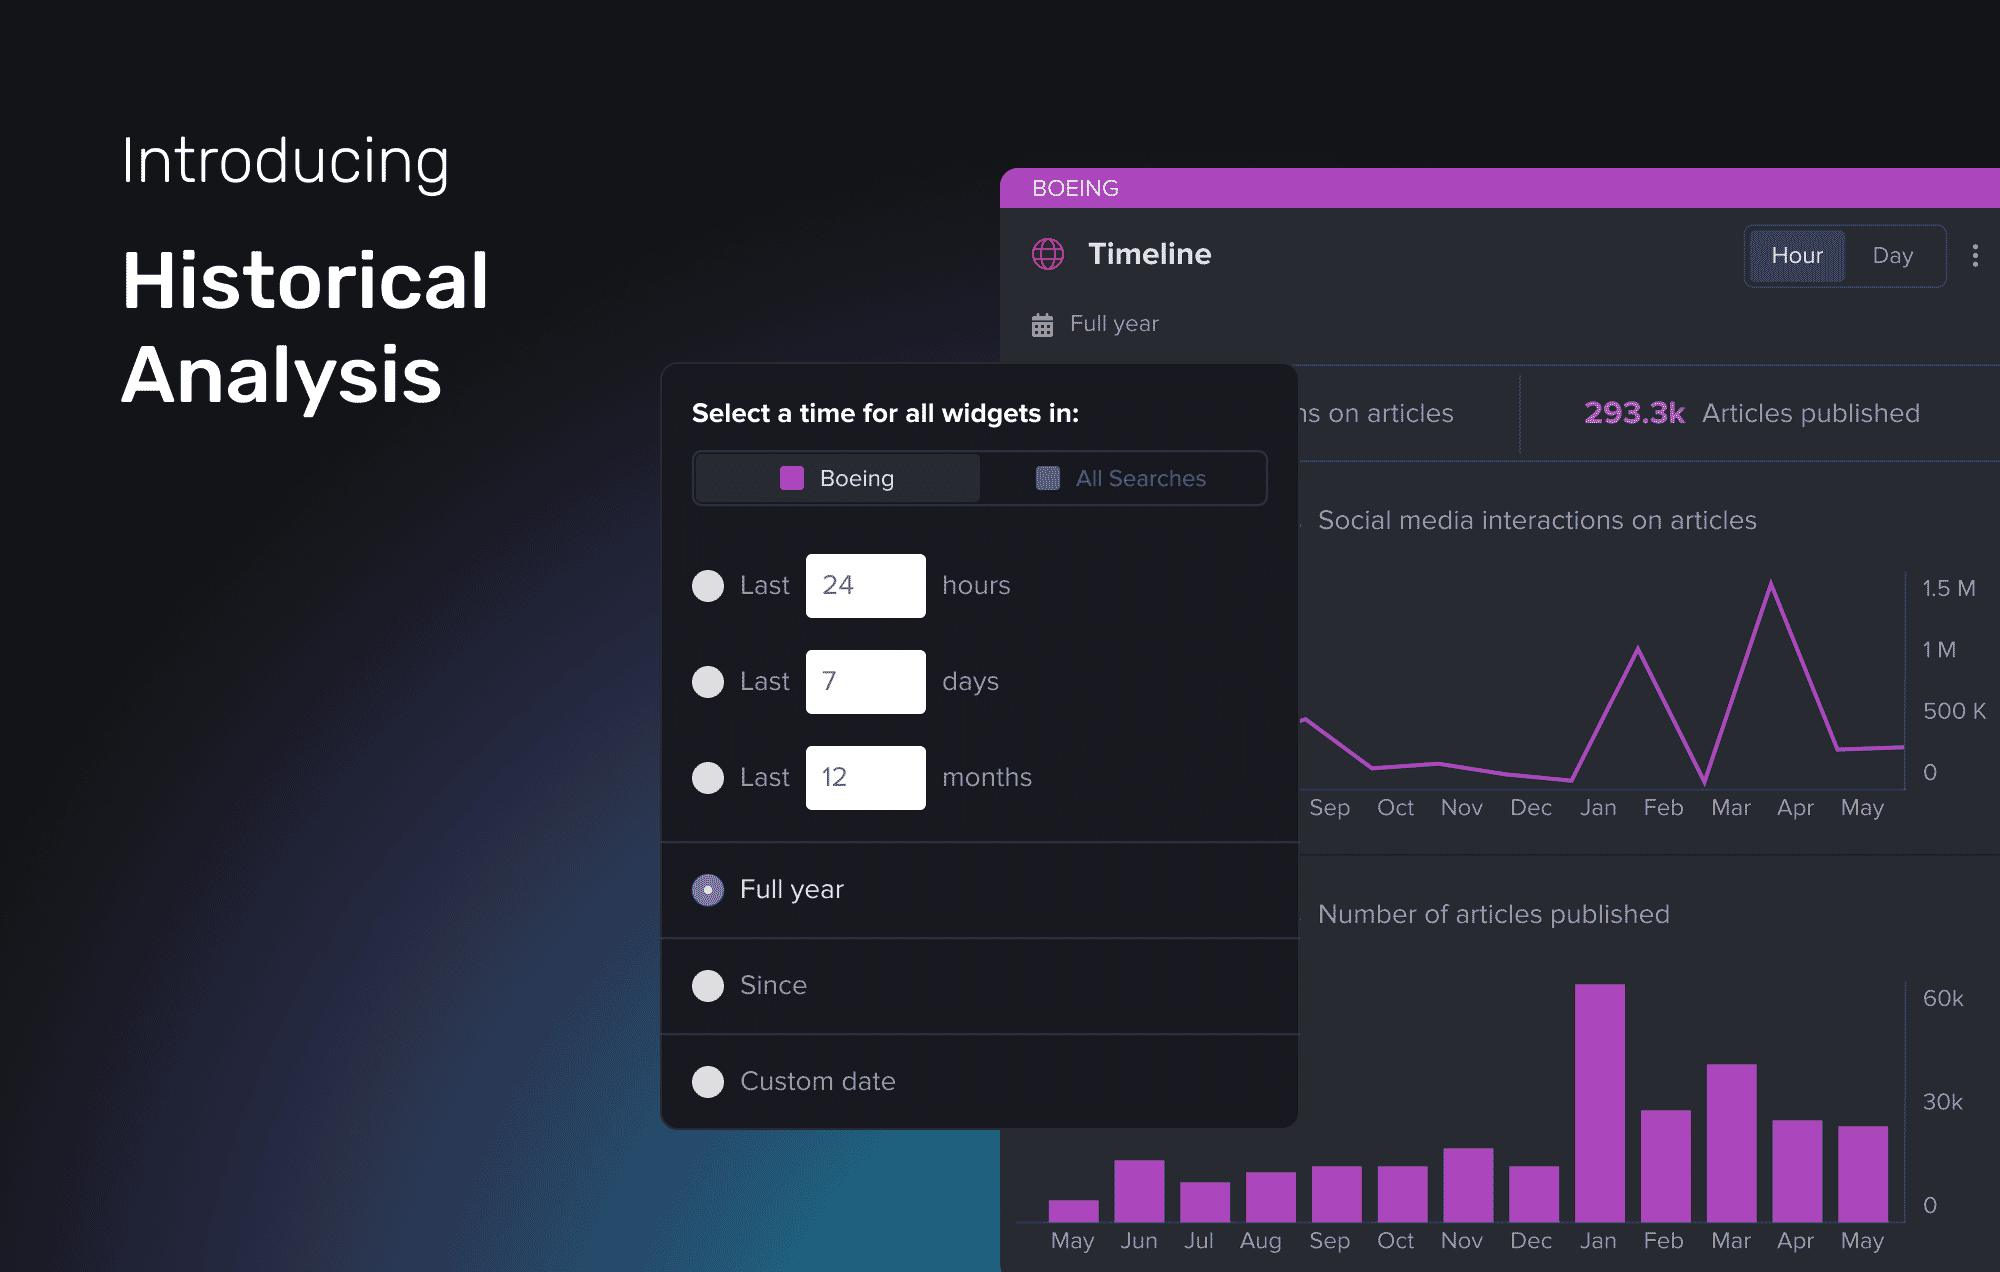
Update: The second phase of Historical Analysis is live! You can now see the top posts on Facebook, Twitter/X, Reddit, Instagram, TikTok, and LinkedIn, up to a full calendar year.
We’re excited to announce that today we’re making a significant upgrade to our Spike platform. Our new Historical Analysis feature enables searches of up to 12 months at a time, allowing users to widen the lens on real-time decision-making and see beyond the present moment to navigate challenges with comprehensive historical context.
This latest update will give you:
- Better context for live situations — Live issues are almost always complex and difficult to contextualize as they are unfolding. Historical Analysis gives you the full picture going back up to 12 months, furnishing you with all recent pertinent information in a single timeline view.
- Insights into ongoing societal and political topics — Historical Analysis is ideal for monitoring ongoing issues of interest to your brand. Be it global elections, sustainability, or coverage of public health crises – this new add-on gives you a complete picture.
- Even more confident decision-making — Historical Analysis gives your team the capacity to go deep into any topic, which adds layers of confidence that you have all the data you need to make the best decisions.
Here are a few examples of what it might look like in practice.
Boeing’s travails, with long-term context
The graph below shows public and media interest in a brand that has been in the news a lot lately — Boeing. The embattled plane manufacturer has had to weather its fair share of live issues in the past year, from planes losing parts in mid-air to whistleblowers raising concerns about the product’s safety.
Whenever there are multiple issues like this, it’s crucial to put them in context. While it may feel as if an avalanche of coverage is happening every time there’s an issue, the data actually shows substantial differences in the peaks of coverage.
In this example we’re comparing all coverage of Boeing in the last 12 months with coverage of safety issues for the plane manufacturer, and you can see just how much of an impact the latter has had on total coverage since the turn of the year in terms of public interest.
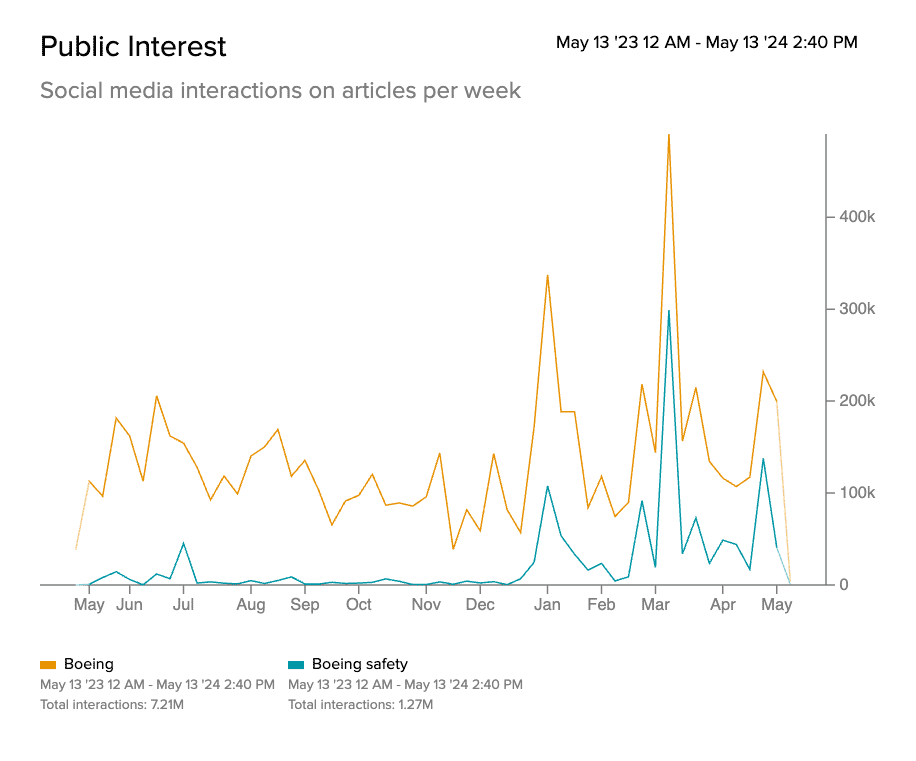
There are several clear spikes where safety becomes the dominant narrative in the conversation, and that knowledge must be taken into account when choosing when and how to approach that coverage as a comms professional. Every live issue requires a different reaction, and the more information you have to contextualize that reaction, the better.
But it’s not just live issues that Historical Analysis will enhance.
Monitor ongoing societal topics
Many topics require a more ‘always-on’ approach. This can include regulatory discussions, brand monitoring, or particular topics of interest to your brand.
An example of such a topic would be a ‘sugar tax’ — a proposition under active consideration by a number of governments around the world to discourage sugar consumption. It’s a subject that frequently comes up in news coverage, but not with the kind of regularity that means it’s reported on extensively every day.

For topics like this, a long-term search of a year, like the one above, is ideal, because it shows you the peaks and troughs in both media and public interest, as well as giving you the ability to click in and see what drove that interest. In this case, it was the Labour Party announcing they were considering a sugar tax in May 2023 that got most of the media’s attention.
Both of the examples showcase the third benefit of the update, which is that your team will have more information and better context to make confident, data-led decisions on how to proceed with the communications strategy for either situation.
As of today, all web widgets will support extended time ranges. These include Timeline, Top People & Brands, Change in interest highlight, leaderboard widgets for Top Authors and Top Websites, as well as the indispensable Web Articles widget. This also includes our recent Report Builder which will be compatible for one-click reporting in PDF or PowerPoint format.
With this feature upgrade, customers will have access to over six years of dependable insights going back to 2018, with the ability to look at a full year at a time in a single search. This enhancement reaffirms our commitment to delivering reliable, detailed, and fast data exactly where you need it.
To learn more about Historical Analysis, reach out to your Customer Success Manager today.

