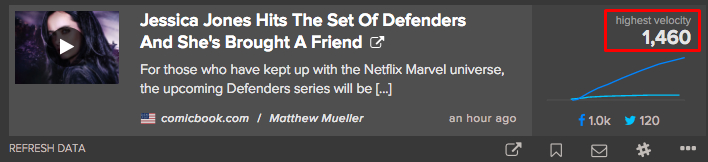
All the stories on NewsWhip and Spike are ranked using their current ‘social velocity’ – how many new shares they’re getting every minute. Here’s an explanation of what exactly this metric is, and why it’s important.

Simply put, social velocity is the rate of change of engagement with content on social media – how many new shares, tweets and other engagements the article, video or picture is getting in a given time. For Facebook, these engagement can mean a share, like or comment. For Twitter, a tweet or retweet of a link. For Pinterest – pinning a piece of content. And for LinkedIn and Google Plus, a share of the content.
The common feature of all these engagements is that they spread a story – they push it in front of more eyeballs, and so contribute to its virality. At NewsWhip, we give a different weight to each type of engagement (a Facebook “share” is worth more than a “like”) when we are calculating our average value for social velocity. Once our calculation is done, we put the most recent score next to each story.
Different stories, different velocities
Some stories – such as those with a dramatic piece of news – can quickly get a very high score as people rapidly click share and retweet. A story about the passing of a famous conductor is a good example of this.
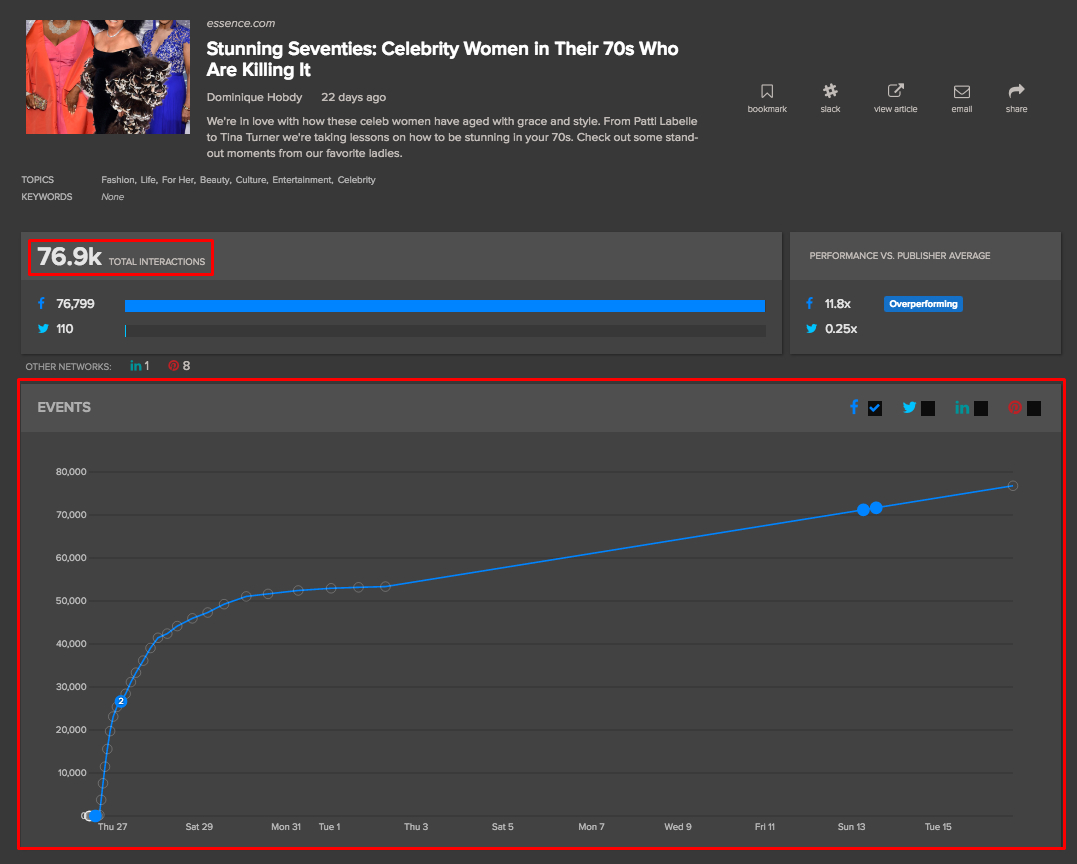
However, these stories often don’t achieve the same high overall sharing numbers as steady viral hits – such as the below example of “Stunning Seventies: Celebrity Women in Their 70s Who Are Killing It” which continue to spread on and on due to their evergreen appeal. These stories can be destined for big share numbers overall – but with a much slower velocity. Notice the “total activity” number of in the story below from Spike.
Why is social velocity important?
Generally, social engagement is a great way to measure the impact of a story beyond page views. It shows that a story did not just draw readers in with a clever headline, it also brought about a reaction and an urge to share it with others. This will often be due to the emotional hooks in a story, a wish to spread information or other prompts we’ve identified that cause people to click “share”.
If we focus only on the volume of engagement, we don’t know what the world cares about right now. We might know a story has a total of 60,000 shares, but when did they happen? Is it still relevant now, today? Only by knowing how many new engagements per hour it’s picking up can we judge whether it is still an important story driving discussion on social media right now.
Examples of social velocity in action
To see the “tip of the iceberg” of the world’s fastest spreading stories on social media, head over to our trending news app.
Nieman Journalism Lab’s Fuego Tool that measures and ranks what the “future-of-journalism crowd is talking about most on Twitter”.
Mashable use their in house tool called “Mashable Velocity” to separate out their faster spreading stories.
For professional newsrooms and marketers, we provide much deeper analysis – such as the stories with the highest social velocity from a city or small niche area – with our professional platform, Spike. Try it for free today.