Last month, we published a report on the state of social video publishing for the first part of 2019. The report focused on video across various social platforms, including YouTube, Facebook, and Twitter.
In the course of our research, we produced a veritable excess of data, especially about Facebook video, that didn’t quite fit into the report in a natural way, so we decided to split it out into a blog post to give the broadest possible insight into the format.
Reactions to Facebook Video
In the video report, we took a look at the Facebook Pages that receive the most of each type of Facebook engagement, be that a like, a share, a comment, an Angry, a Sad, a Love etc. Here’s a reminder of what that looked like, for those that may have missed it.
After all, total engagement, while interesting, is not the be all and end all of video content. Different Pages will have different goals for their content. Some will want to drive comments, some shares, and some will produce content that elicits another reaction entirely.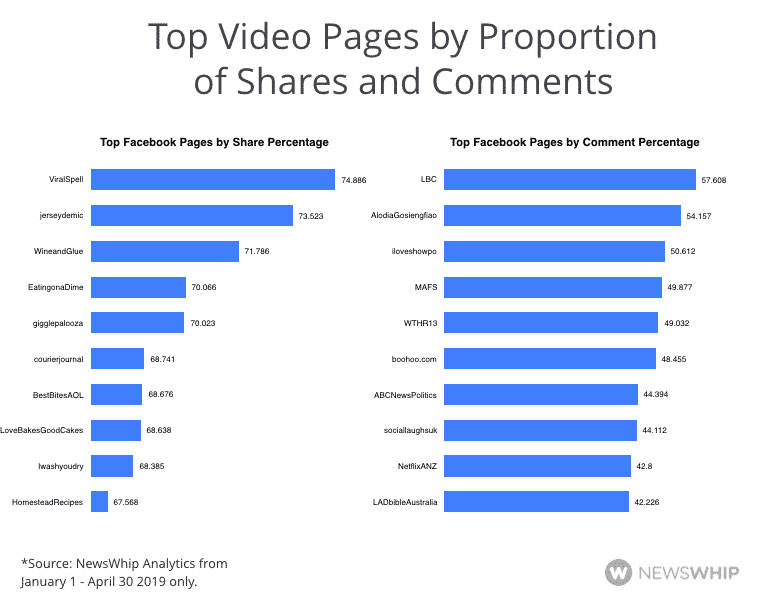
As such, we broke out the top content by proportion of engagement made up of the different reaction metrics, for Pages that have posted a minimum of 100 times in the four months that we looked at. Below we have the data for shares and comments.
 For shares, it is very much viral videos, especially funny ones, though there is also a place for recipe Pages to have a high number of shares.
For comments, British talk radio broadcaster LBC had a particularly high proportion of comments on its videos, perhaps because of the nature of the content uploaded, which invites viewers to have their say.
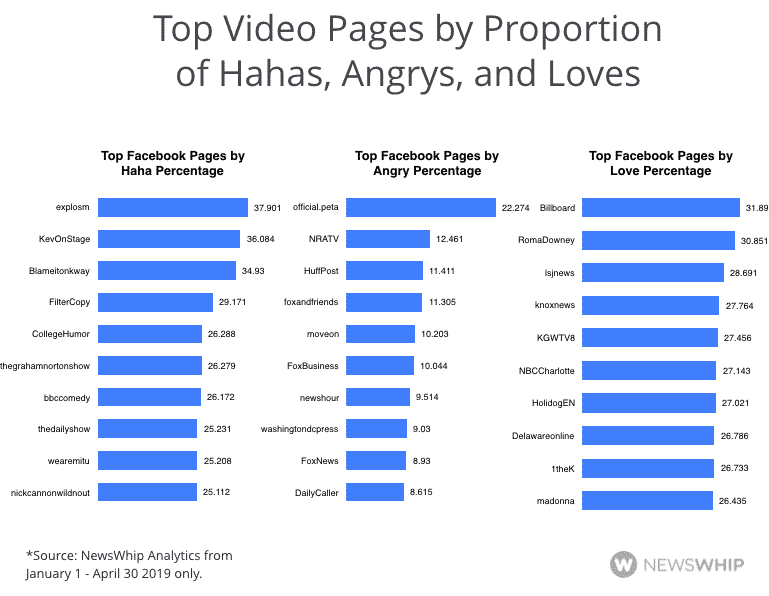
For top Pages by Hahas, Loves, and Angrys, there were a few trends that stood out.
For Hahas, the comedy accounts and meme accounts came out on top, with KevOnStage, Graham Norton, and The Daily Show all seeing particularly high proportions of laughter to the videos that they posted.
For Loves it was the local and the musical that did well, with a number of local news publishers’ Facebook Pages seeing a lot of Love compared to other reactions, as well as Billboard and Madonna.
Political content drove Angry reactions, as well as content from PETA. Aside from the Peta account though, every publisher with a high proportion of Angrys was involved in political reporting or campaigning in some way.
But how did this translate into the actual top posts for this type of reaction? We did an analysis of the 10,000 most engaged videos on Facebook from January 1st – April 30th to see how people engaged with them.
Top Native Videos by Facebook shares and comments
We started with looking at the most shared videos, and the results tracked with the data we saw from the Pages with a high proportion of shares.
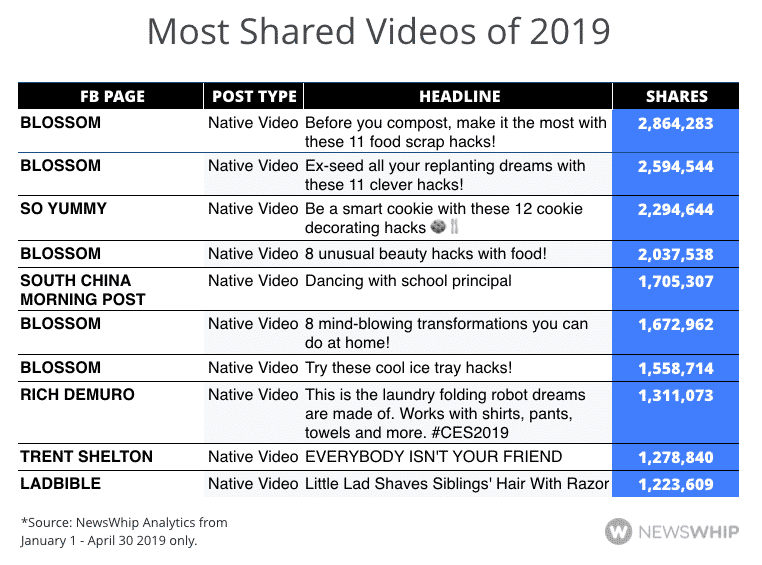
The most shared videos had share numbers in the millions, and Blossom truly dominated the space, with half of the top ten most shared videos coming from their Page. Most of the videos were hacks or how-to videos of some form, with six videos (arguably seven if you include the laundry folding robot) falling into that category, of which Blossom was a particular driver.
For comments we saw a significant decrease in the raw numbers, as videos with a high number of shares tend to have much higher numbers on shares than those leading in other categories have for their respective reaction metrics.
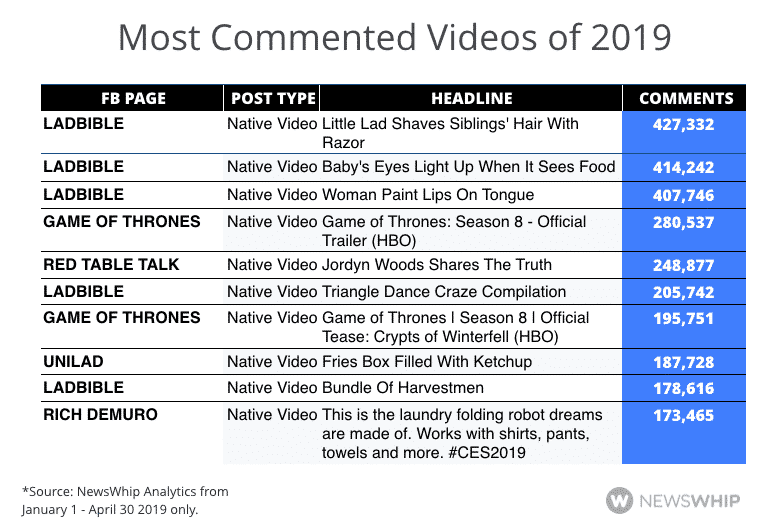
Again, there was a clearly dominant Page in terms of the most commented videos, and this time it was LADBible, which appeared five times in the top ten with its viral videos. The most commented video also happened to be the tenth most shared video from the previous list.
Many of these comments, especially for the viral publishers, are people tagging their friends in the comments so that they see the post, though this is obviously not exclusively the case.
Beyond LADBible and UNILAD, the Game of Thrones trailer stirred some conversation, and the laundry folding robot made another appearance.
Top Native Videos by Facebook Loves, Hahas, and Angrys
The two most commonly used reactions to Facebook video from January through April of this year were Love and Haha, making up ten percent and six percent of the reactions to the top 10,000 videos for that time period. Although Angrys were the least common reaction type, we have also included it in this analysis, as it is the most distinct metric from all the others and surfaces a different type of video.
For Loves, it was a different story to what we saw for shares and comments, at least in terms of the fact that there was not one dominant Page.
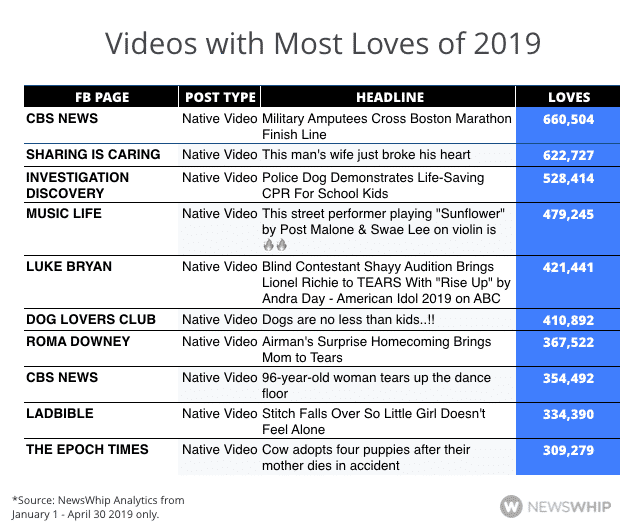
CBS News had the top video with military amputees running the Boston Marathon, and beside that there were a number of animal and family videos, as well as some musical performance videos.
For Hahas we saw a significant amount of success for It’s Gone Viral, with all three of the top videos coming from the publisher.
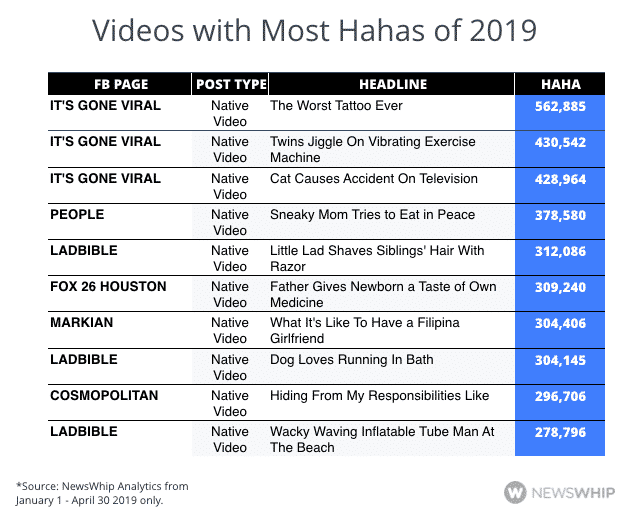
The posts that drove Hahas tended to be again focused on family dynamics, particularly with young children and their parents, but animals also featured heavily.
As for Angrys, the first thing to note is that the raw numbers are much lower. The top post received 98,000 Angrys, as compared with over half a million for Loves and Hahas.

There tended to be much more explanatory text for videos that drove the Angry reaction, and there was a definite focus on politics and violence, especially powerless people and animals being hurt.
All in all, what this shows is that there is a great variety between what videos drove different types of reactions. Apart from a select few, there was almost no repetition in the rankings, with only a couple of videos appearing in more than one list.
Here are some takeaways:
- Shares were the most prevalent type of reaction outside a simple like
- The videos with the most Loves were often about overcoming adversity
- LADBible dominated the most commented videos
- Angry reactions were driven by political content
- Shares were often driven by hack and how-to content
Want to see these insights for yourself? Take a tour of NewsWhip, or if you’re curious for more insights, download our recent video report.

Benedict Nicholson
Benedict Nicholson is the Managing Editor at NewsWhip. An Englishman in New York, he is interested in the intersection of PR, brands, and journalism, and the trends and innovation around that.
Email Benedict via benedict.nicholson@newswhip.com.