Earlier this week, we looked at the distribution of interactions across Facebook publishers’ content. Now we’re examining the same area for Twitter.
Using data from our ever insightful Spike platform, we’ve come up with some breakdowns of Twitter sharing patterns for different publishers.
Many of the Twitter charts look a bit different from the Facebook ones.
Twitter has lower interactions levels than Facebook – BuzzFeed had over 47m interactions as Facebook’s biggest publisher last month, while the BBC was Twitter’s most-shared, with just over 2.7m tweets and retweets. However, this doesn’t mean that quality content isn’t shared as voraciously on Twitter – it’s just a bit harder to quantify who’s talking about it. For now, there’s no easy way of counting a ‘reply’ as an interaction to a story shared on the network. In any case, tweet and retweet figures give us an interesting enough look at the overall trend.
Again, these figures are based on content published during the relevant month only, in this case, February.

Higher activity to the right of the chart indicates higher engagement rates with content. It’s important here to remember the difference in content forms shared on Facebook and Twitter. At the high end of Facebook scale, interactive quizzes, listicles and video links do extremely well. On Twitter, that differs. There’s more talk about media, tech and news, and news and tech sites perform very strongly overall. The BBC is a publisher that does extremely well out of this difference – they’ve been the biggest publisher on Twitter since we started these records last August. Much of this has to do with their timely news updates, dispersed to their ever-growing followership.
It’s not very clear with the above scales, but the BBC had two articles get between 78,125 and 390,000 Twitter shares in February. This shows just how hard it can be to attract enormous shares on Twitter.
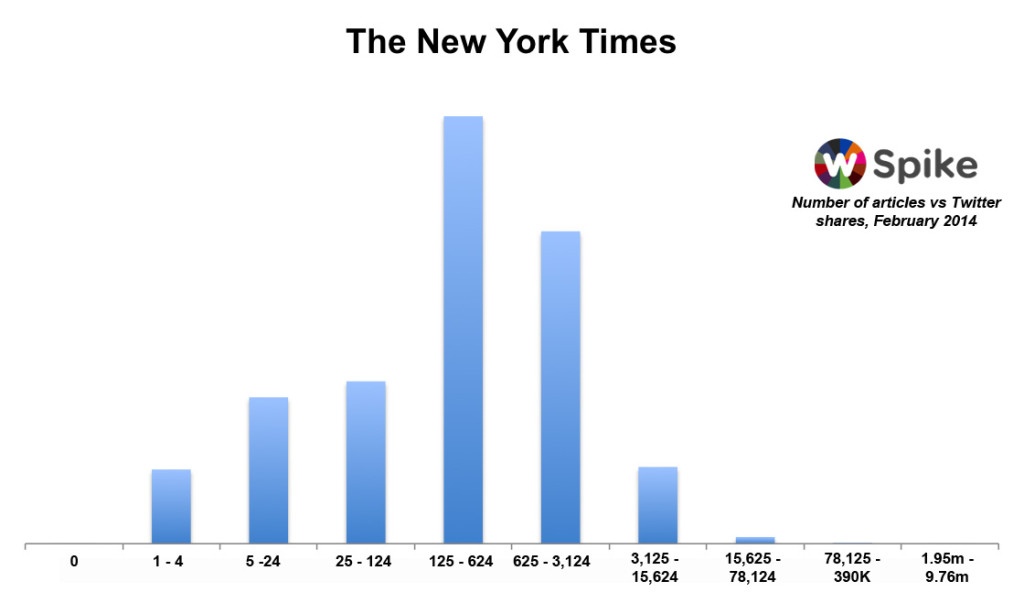
Here’s the next biggest publisher, the New York Times:
Meanwhile, here’s Mashable:
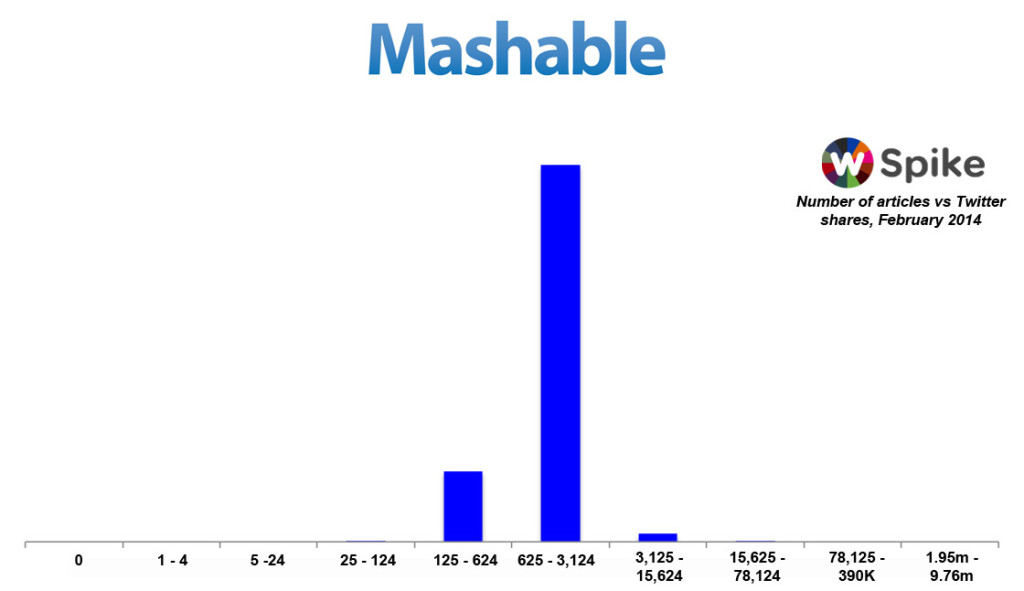
Mashable has an incredibly interesting shape – look at the overwhelming number of stories that get shared between 625 and 3,124 times. Last month we recorded the site publishing less than 1,500 articles, and this graph goes some way to explaining how the tech-focussed site manages to maintain such a strong presence at the top of the Twitter charts. Practically everything it publishes gets serious Twitter traction.

BuzzFeed shows us something interesting about the nature of popular content on Twitter – interactive quizzes don’t go down as well on the network. For the last few months, interactive quizzes have been BuzzFeed’s best performing pieces of content on Facebook.
In March, their most popular story on Twitter was ‘15 Things you Didn’t Know Your iPhone Could Do‘. An article on a Harvard photography project also proved popular.
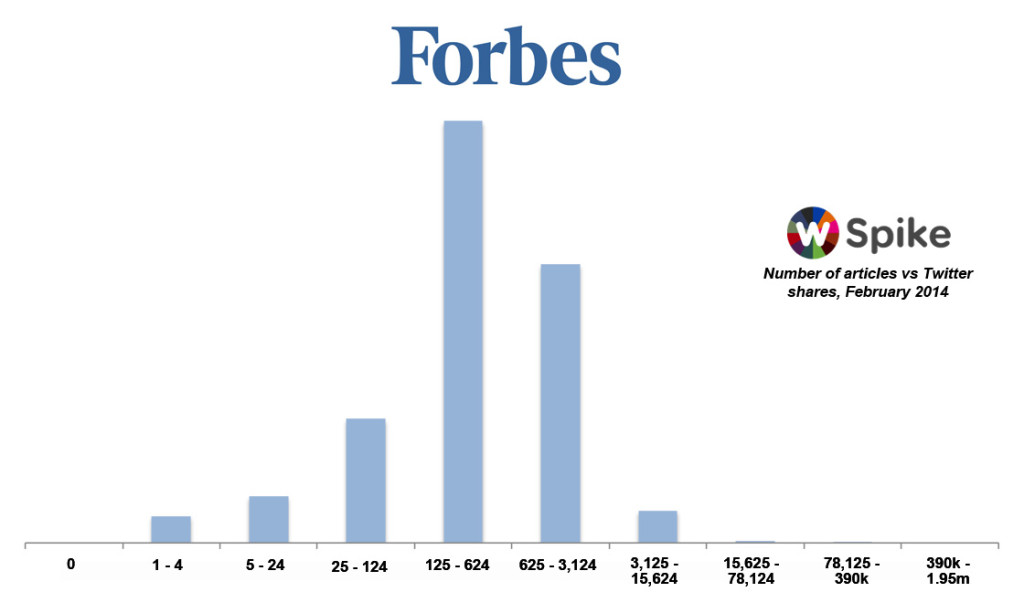
Here’s Forbes, with a similar range of sharing activity:
The takeaway from this is the same as what we saw with Facebook – know your audience, and watch the shares roll in.
For a closer look at the data, other publishers’ breakdowns, or any other related queries, drop us a line at spike@newswhip.com.
All data was extracted from Spike, our leading content discovery platform. It tracks up to 250,000 stories as they’re shared in real time on social media – try it out here.