We look at how many Facebook engagements that the majority of articles get.
Every month, we rank the biggest publishers on Facebook and Twitter in terms of total engagements (likes/recommends, shares and comments) for content published throughout the month. This sums to a huge amount of very interesting and detailed data, and grants us a useful overview of whose content performs on different networks from month to month.
However, one variable comes up time and time again – the difference in the amount of content published by different sites each month. We know that more content does not automatically mean more shares, and that this does not only apply to viral-focussed sites like the Independent Journal Review (4th place overall last month with 630 stories). Smaller sites like The Onion, Think Progress and Slate consistently do well in our rankings, without publishing huge volumes.
Curious about this, we decided that it was time to have a look at the spread of shares from different publishers. Using Spike, we calculated Facebook interaction percentiles for different publishers, based on data from the month of February 2014.
First up, here’s what BuzzFeed’s spread of shares looked like in February:

The second biggest Facebook publisher, the Huffington Post, looked like this:
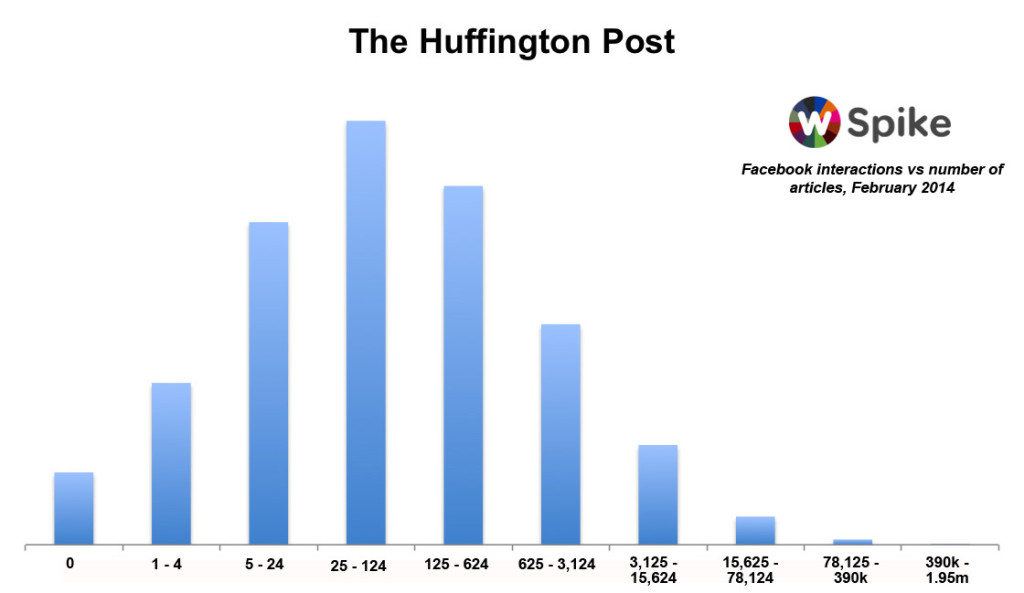
The higher the bars on the right of the graph, the more viral stories from each publisher. Higher bars towards the left indicate less engagement with content.
It’s interesting to see where the peak lies for different publishers. The Huffington Post publishes more than BuzzFeed per month, but the majority of their articles get between 25 and 124 interactions on Facebook, as opposed to 625 and 3,124 for BuzzFeed.
Meanwhile, BuzzFeed are getting a reasonable number of stories with up to 390,000 interactions and higher each month, which goes a long way to explaining their huge monthly totals.
Using the same scales, here’s the Facebook engagement breakdown for some of the bigger traditional news sites:
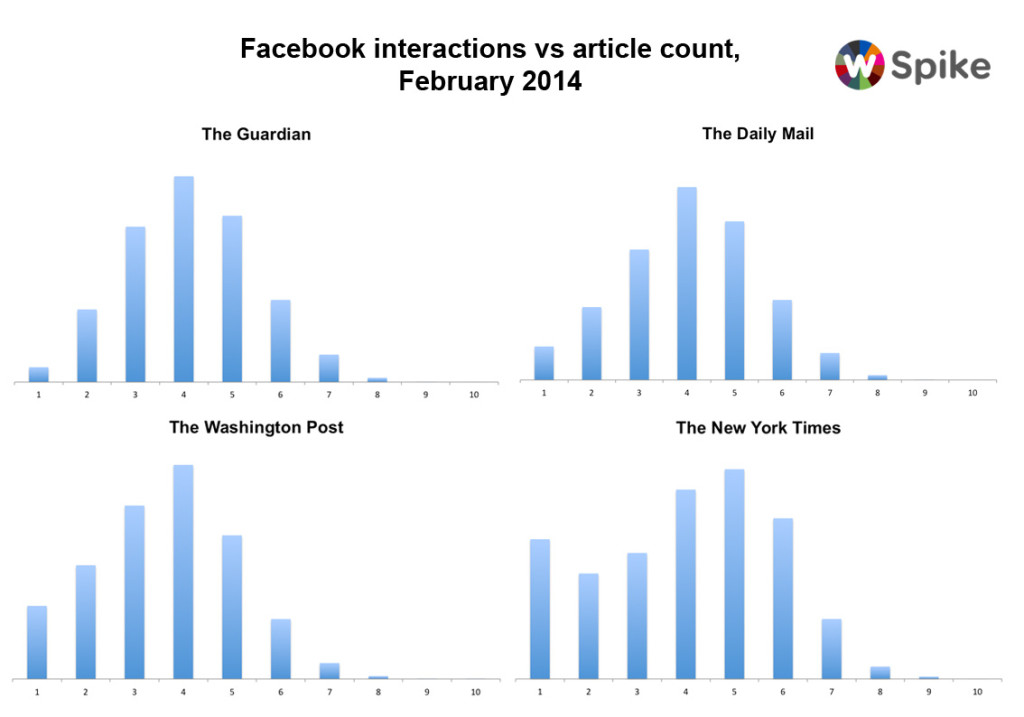
Interestingly, the New York Times manages a dual peak, with a substantial number of stories getting no Facebook engagement, and another significant cohort getting between 125 and 624. As you can see, none of these sites experience the same engagement on the upper end of the scale that BuzzFeed do.
Meanwhile, here’s what Upworthy’s share spread looked like in February:
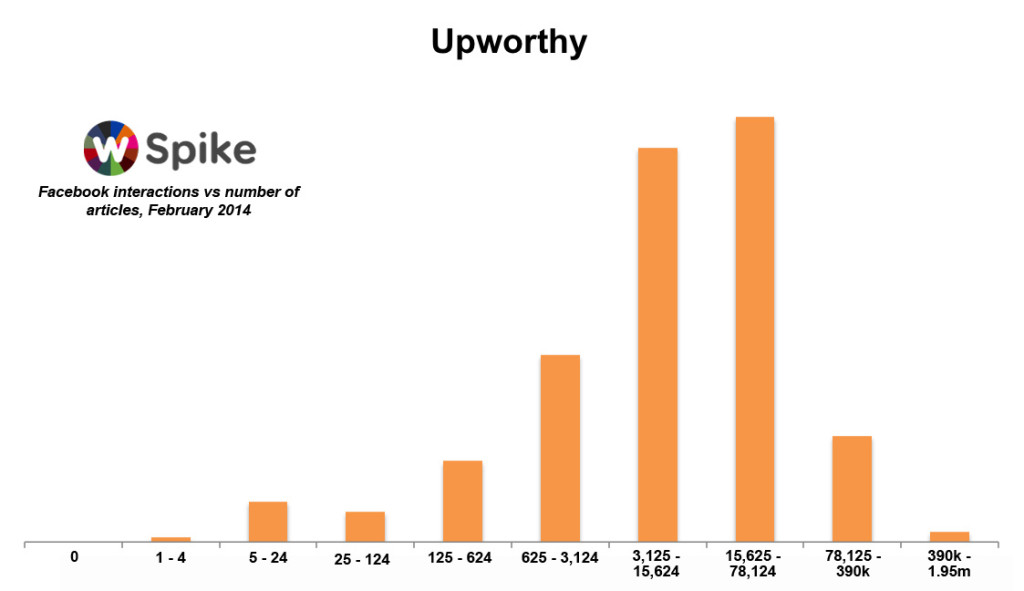
This is impressive – Upworthy’s most common engagement range sees them get between 15,625 and 78,124 interactions. That’s how similar sites manage to get so much traction with so little content.
But our top publisher rankings aren’t just dominated by viral powerhouses and well-established news organisations. The rankings also consistently feature more niche publishers, such as The Blaze, MindBodyGreen, Business Insider and Think Progress. The inclusion of these publishers in the top 50 or even 25 rankings is perhaps just as impressive as BuzzFeed’s huge growth at the very top. These sites publish comparatively little (last month, The Blaze was 10th overall, with under 1,500 pieces of content), and don’t solely rely on viral stories for shares. How do they do it? It seems by making sure that whatever they publish is going to get strong engagement:
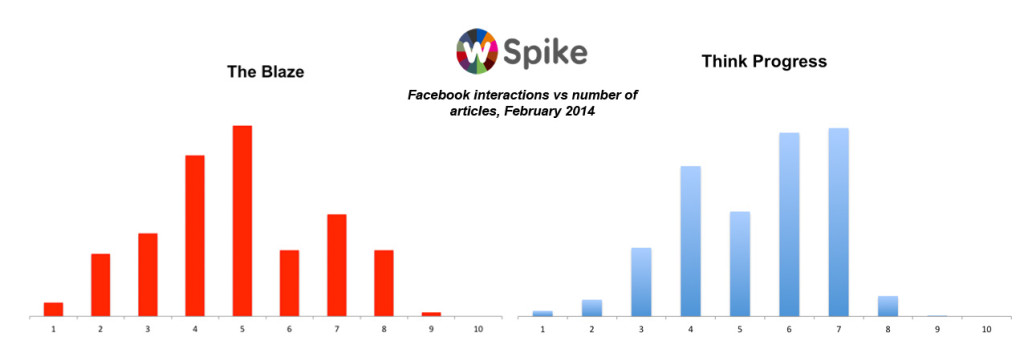
You can see that both publishers, who target different audiences in similar ways, hit high engagement rates despite their relatively low article counts.
And that seems to be the key learning from all of this. By ensuring tight quality control, and knowing your audience inside-out, it’s possible to take on the New York Times.
For a closer look at the data, or any other related queries, drop us a line at spike@newswhip.com.
We’ll be back with a look at Twitter’s spread of shares later in the week. For now, be sure to sign up for our weekly email newsletter, if you haven’t already done so.
All data was extracted from Spike, our leading pro content discovery platform. It tracks up to 250,000 stories as they’re shared on social media every day – check it out here.

Flipping the Script: How Brands Can Reclaim the Narrative in a Crisis
NewsWhip’s Head of Marketing, Kevin Twomey, recently took part in a panel hosted by PR firm Red Consultancy, alongside corporate comms leaders from Lidl and Caffè Nero. The event focused on a challenge that every communicator knows all too well: what to do when your...